Both Splunk and Kibana play an important role when it comes to evaluations and analyzing IT operations.
Both are used for analyzing log-based data.
Splunk processes the machine-generated data, which is needed in order to generate a meaningful one. This, in turn, helps in better visualization of data as well as an understanding of it.
Kibana also helps in visualization of log data in the form of pie charts, bar graphs and line charts. It is dependent on Elasticsearch for the extraction of log data.
Kibana also allows users with multiple options, like analyzing the type of browser needed to support based on a particular audience.
Moreover, users get the option of analyzing real-time traffic by mapping website visitors. Kibana also allows users to create multiple dashboards according to the roles you need to visualize data for.
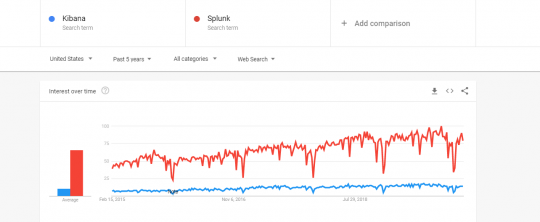
Google Trends: Past 5-year Comparison for Kibana vs. Splunk

From the above diagram, it can be observed that Splunk has been far more popular than Kibana in terms of user priority.
Kibana is considered to be the competitor for other tools based on the variety of options that it provides to its users. Kibana needs more work as well as planning, in the beginning only to easily extract the values later.
Options like interactive charts, easily accessible dashboards, pre-built filters and aggregation makes it easy for the users to run maximum analytics with one click.
To improve performance Splunk has to be given certain provisions, like:
- Ensuring more systems are dedicated to working alongside Splunk which eventually increases its performance.
- There needs to be a balance between speed and redundancy for which faster availability of disks is needed and hardware supporting RAID 10.
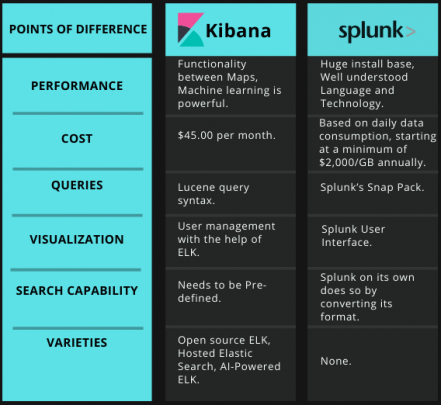
Kibana being an open-source data visualization tool is free. However, to use it as a hosted service it costs around $45.00 per month.
The pricing of Splunk is based on the daily data consumption which starts at a minimum of $2,000/GB annually and also $5,400/GB as a perpetual license.
Query in Kibana is based on the syntax “Lucene query syntax”. As for now, it is still being made available for users under the query bar.
Updates like scripted field support and simplified syntax to use have been introduced in Kibana 7.0.
Selecting this legacy query language, users have the option of using JSON (JavaScript Object Notation) based Elasticsearch query.
To execute a query in Splunk, Splunk’s Snap Pack is used. A Splunk query is used within Splunk software for running specific operations.
For defining log files and extracting information from data produced through machines Splunk’s query language is used.
Visualization in Kibana is presented through the medium of charts, tables. In Kibana query is automatically applied to the elements of the dashboard.
User management provided in Kibana is out of the box with the help of hosted ELK solutions.
The user interface in Splunk allows its users to edit or add new components to your dashboard. Multiple users can create a customized dashboard. The control for multiple users can be configured differently in Splunk.
Also Read: Kibana vs. Grafana: Comparison of the Two Data Visualization Tools
The search function holds the key in the architect of any platform managing logs.
In Kibana, if non-configured fields are to be searched, the properties for the same need to be pre-defined for aggregation over the log properties.
In Splunk, if non-configured fields are to be searched, Splunk allows its users to do so by converting its format in accordance with the same.
There are as of now three main varieties linked with Kibana tool, which are:
- The open-source ELK Stack platform, maintained by Elastic.
- Hosted Elasticsearch, maintained by Amazon Web Service.
- AI-powered ELK on an enterprise-grade platform, maintained by Logz.io.
Splunk has no varieties at present.
Kibana vs. Splunk Comparison Via Tabular Diagram

Also Read: How is Big Data Analytics Helpful for Security Intelligence?


